The warehouse had no map.
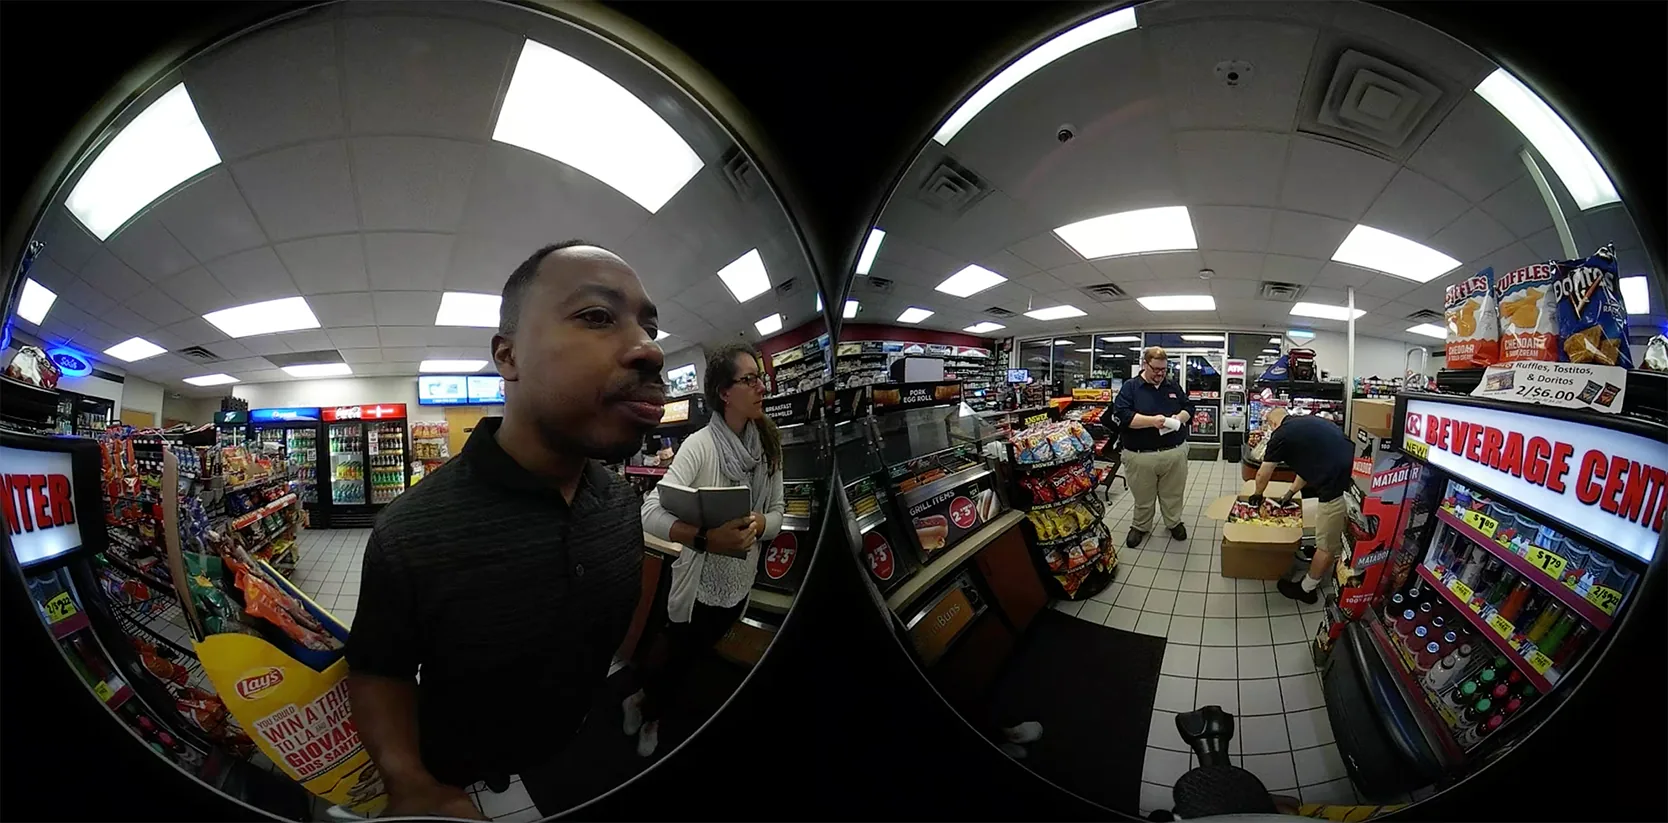
Two weeks embedded as a Frito-Lay driver's assistant, filmed in VR 360 so executives could put on a headset and turn around inside the cab rather than read a report about it. The costliest finding came from a driver never on the schedule — one noticed looking visibly stressed in a Kroger, and stopped to ask about. He had driven all the way out to build his end caps, and only found out on arrival that part of his shipment was missing. Nothing had told him at the warehouse. Nothing had told him on the way. The customer's shelf was the error report.
The value, in twenty seconds.
Frito-Lay's CTO team was building apps for delivery drivers without UX research. The challenge was to produce research that would both inform design and convince leadership that doing it first was worth the time. Nobody had mapped the driver's real day — and nobody had looked at what happens when the plan breaks.
I worked two weeks as a driver's assistant and filmed the whole thing in VR 360, so executives could put on a headset and stand inside the cab. The most valuable finding was not on the schedule: I noticed a stressed driver in a Kroger on a separate ride-along, stopped to ask, and followed him back to the warehouse — where the real problem was a building with no map.
A field study that surfaced friction interviews had missed, a reconstructed delivery sheet that showed the company had already codified how orders go out wrong, a cost model that turned a UX finding into a line item, and a four-screen pick-tool concept that closes the loop. Several years later PepsiCo publicly identified much of the same operational territory as a strategic priority.
Apps built without research. A driver's day nobody had walked.
The CTO's innovation team at Frito-Lay was standing up new applications for the delivery force. The apps were being scoped and built without formal UX research — which meant the design was going to have to defend itself later, against friction the team had not yet seen.
The brief that came back was simple: produce research that would both inform the design work and convince leadership that doing it first was worth the delay. Two constraints were quiet but sharp. First, the answer had to survive the trip from the field to a conference room. Second, the person delivering that answer needed to have actually been in the work — because that is the only version executives could not argue with.
I ended up in a Frito-Lay uniform for two weeks. A camera capturing the day in 360. And, on the ride-along that mattered most, no schedule at all.
Uniform on, headset off. Two weeks on the truck.
Shadowing gets you a description of the job. Being in the work gets you the warehouse. And the most valuable finding of the whole study was not on my schedule at all — it came from noticing one stressed driver in a store and deciding to ask. A research plan gets you coverage. Paying attention gets you the thing nobody thought to tell you.
Learn about the framework →I ran ethnographic field research as a Frito-Lay driver's assistant for two weeks in July 2018. Recorded the whole thing in VR 360 — executives back at HQ could put on a headset and be in the truck rather than reading about it, and that removed the step where someone has to take my word for a workflow.
On top of the field study I facilitated employee interviews on the route and at distribution, documented the customer journey drivers actually used (including the workarounds they depended on to finish a shift), designed a reconstructed delivery sheet that made the paper the whole problem in one object, built a cost model that turned the friction into a line-item leadership could act on, and prototyped a four-screen pick tool that closes the loop the study exposed.
Also delivered alongside the study: a design-thinking practice MVP for the CTO's innovation team, so the pattern of "get in the work, then design" could keep going after I left.
On the truck, not observing from the side.
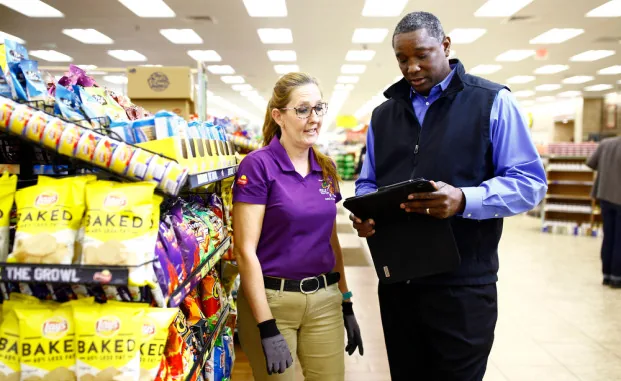
On the route as a driver's assistant, uniform on, cart-pushing included. Pain points recorded live — including the ones nobody raised in an interview because they had learned to work around them.
He wasn't on the schedule. He was the whole finding.
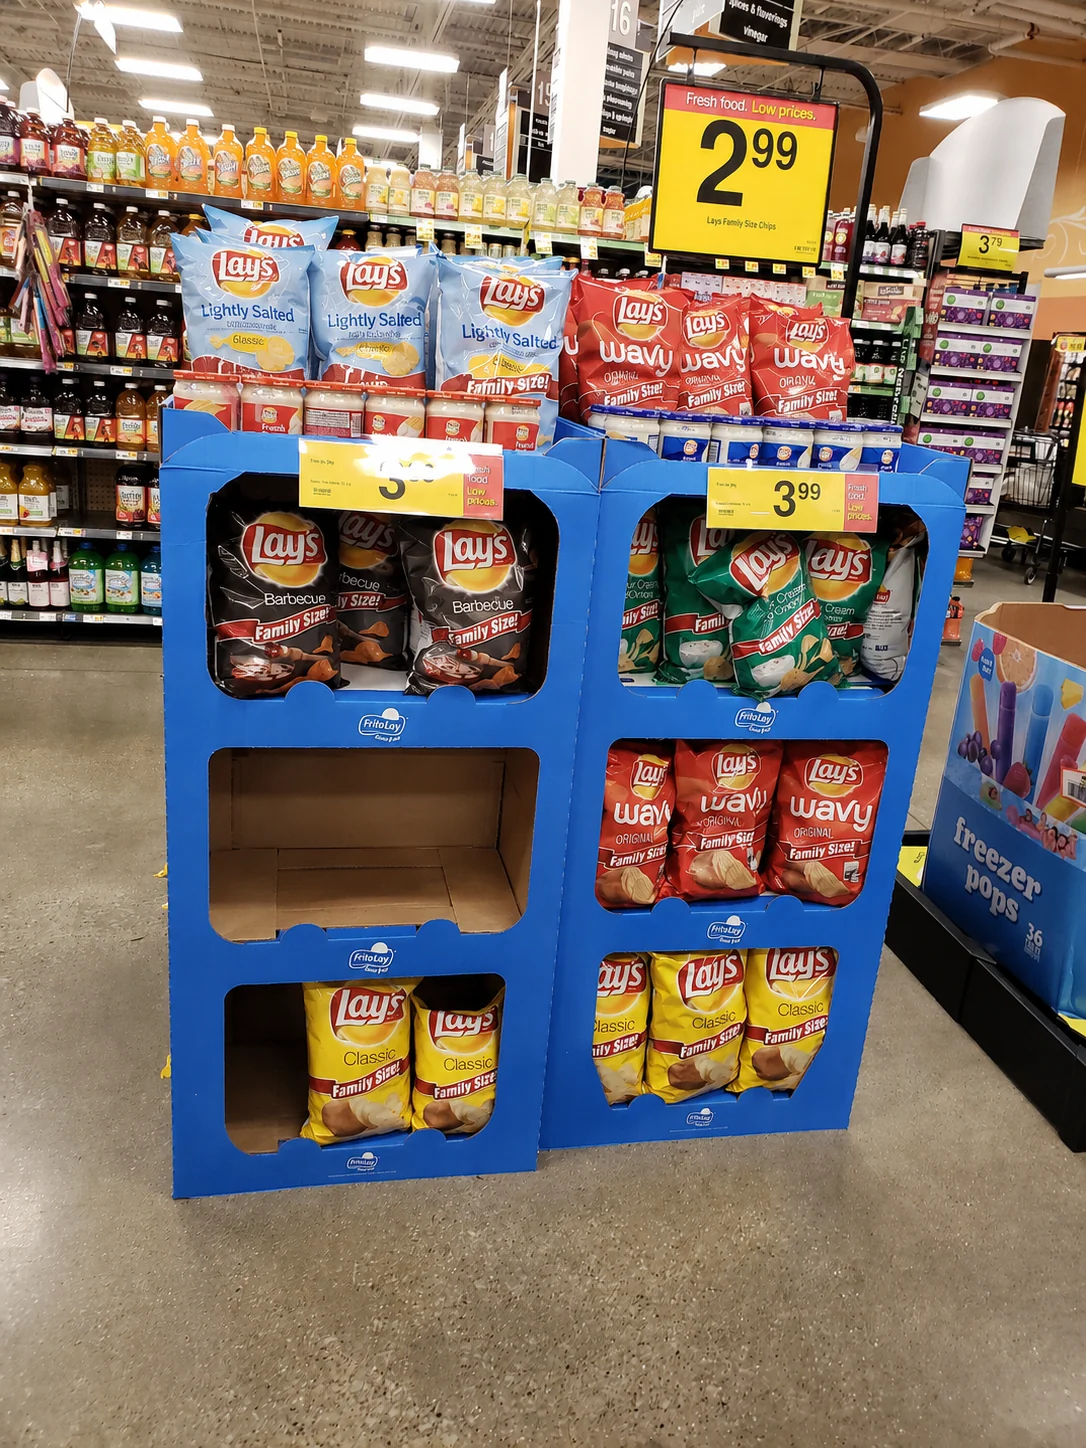
I was in a Kroger on my own ride-along when I noticed a driver who looked visibly stressed. So I went over and started asking questions. He had started in March. He had driven out to build his end caps and only found out on arrival that part of his shipment was missing. Nothing told him at the warehouse. Nothing told him on the way. No system tracked what was actually on his truck — which meant the customer's shelf was the error report.
The strongest evidence was already printed on the delivery sheet.
The sheet carries seven pre-set error codes — one of them for cart loading. So the company already knew orders went out wrong often enough to codify it. What it did not have was any way to catch one before the truck left. Every line pairs a product code with a truncated description, and turning one of those into the right carton somewhere in the building is the task nobody had measured. Rebuilt here with example values; the original carries a retailer's address and live order details.
Circle error code associated with unit error
- Case pack error
- Case count error
- Incorrect product
- Wrong department
- Unauthorized product or pricing issue
- RSR procedural error
- OPS cart loading error
| Error type | Cases | Units | UPC | Description |
|---|---|---|---|---|
| 1234567 | 3 | 36 | 000000159388 | 4.29 RG CLASSIC |
| 1234567 | 1 | 3 | 000000576055 | 32CT VP MIX BOX |
| 1234567 | 2 | 10 | 000000083140 | 4.99 TO ROUNDS |
| 1234567 | 2 | 10 | 000000064040 | 4.29 LIM CITRUS |
| 1234567 | 1 | 8 | 000000184779 | 3.29 BK CHS RUF |
| 1234567 | 2 | 16 | 000000183833 | 3.29 BK BBQ RID |
| 1234567 | 1 | 8 | 000000639552 | 3.99 REG LTBITE |
| 1234567 | 1 | 10 | 000000589888 | 3.49 CT JAL MLD |
| 1234567 | 4 | 24 | 000000643061 | 4.99 DR NAC PZA |
| 1234567 | 2 | 14 | 000000064057 | 4.29 BTSZ RND TO |
Then the real problem started.
He drove all the way back and rebuilt his day around a trip that should never have been necessary. He works from a printed sheet, and with that sheet in hand he walks the building reading labels until he has found everything on it. The photos below are the building he walks. The pattern across all of them is the same inversion: the building labels the things that move and leaves the things that stay put unmarked.
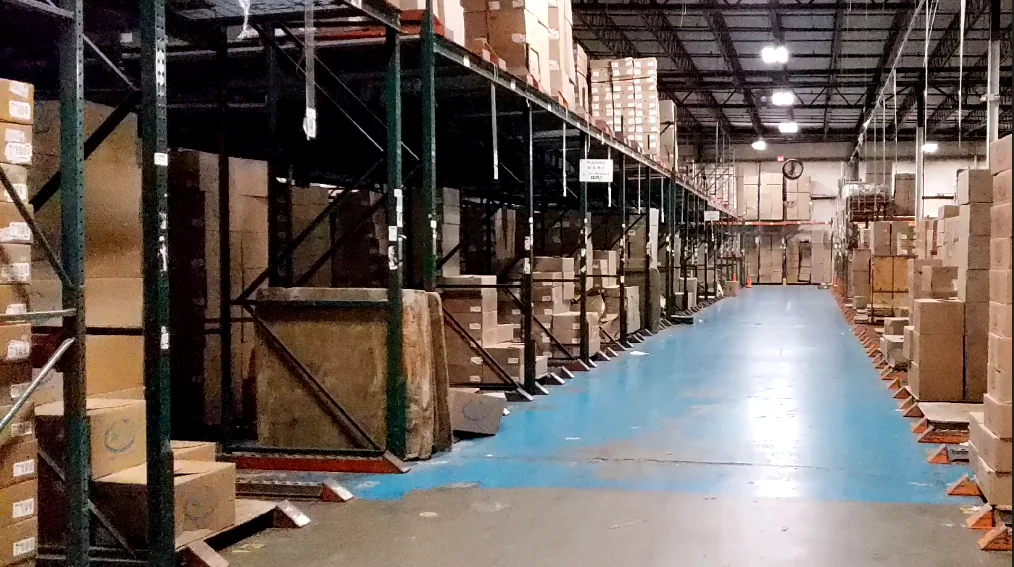
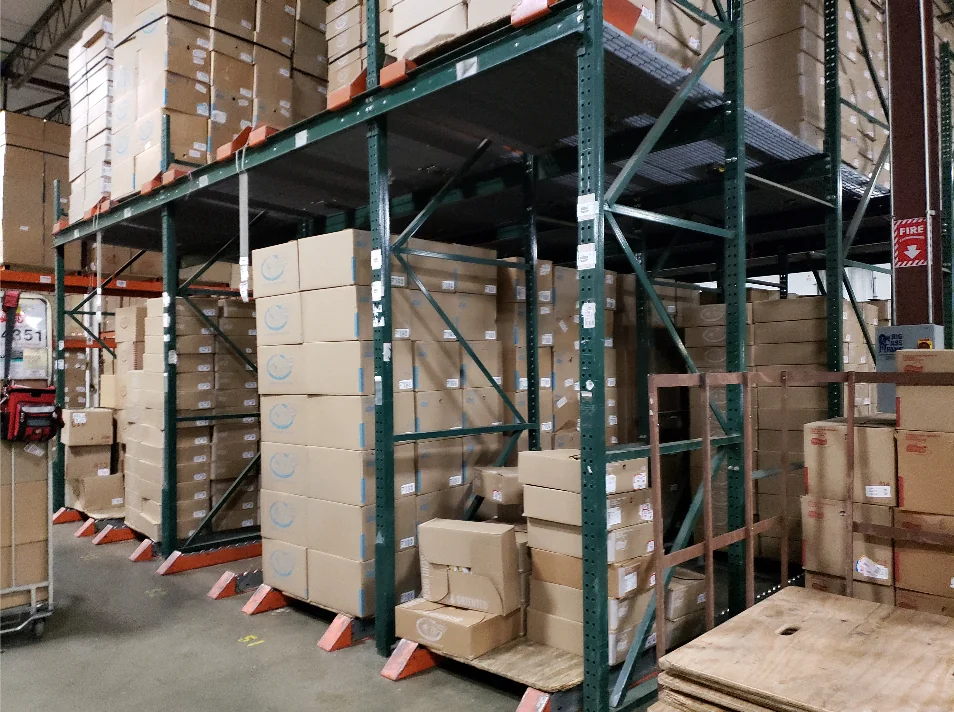
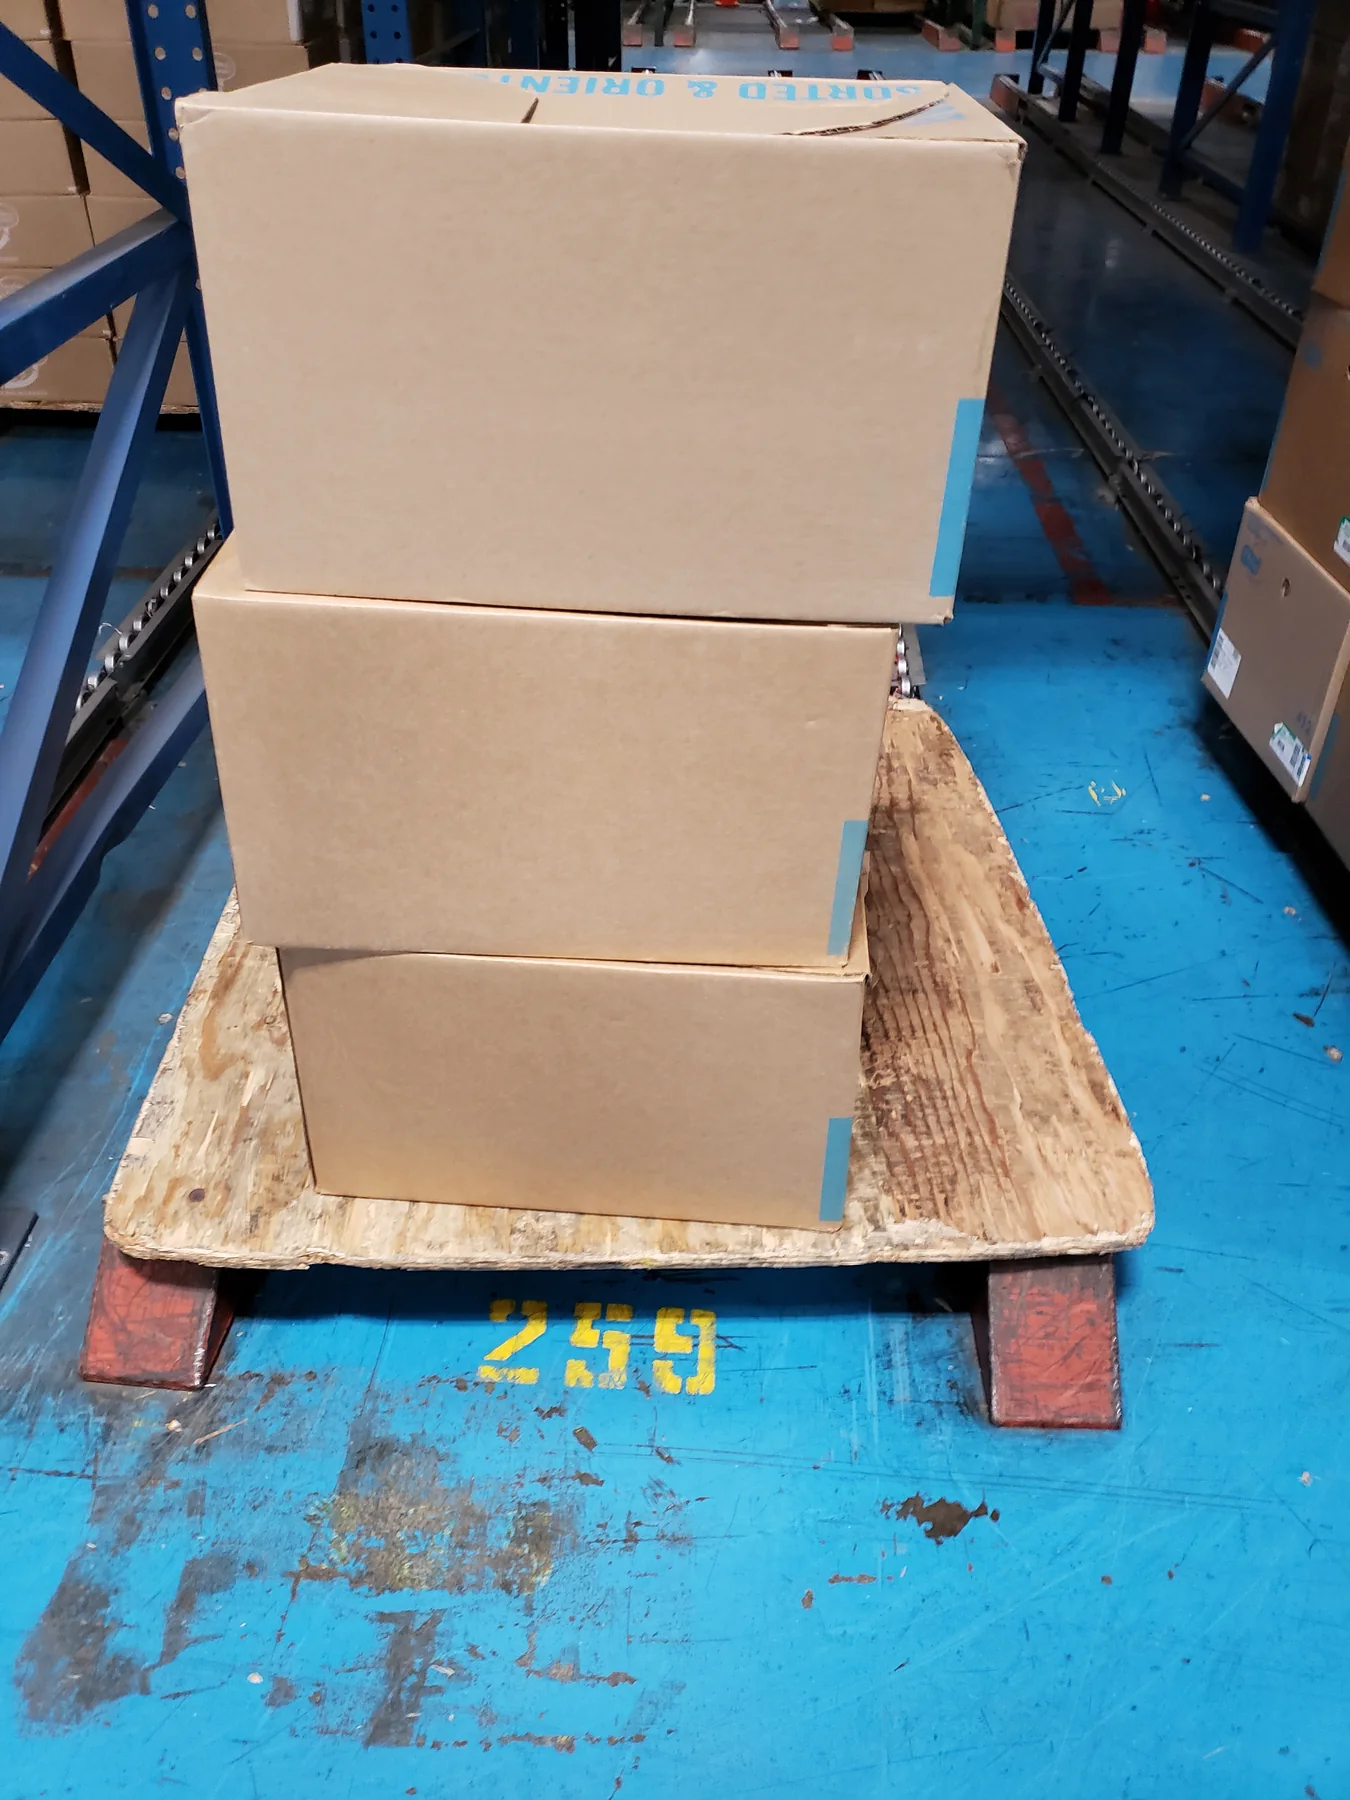
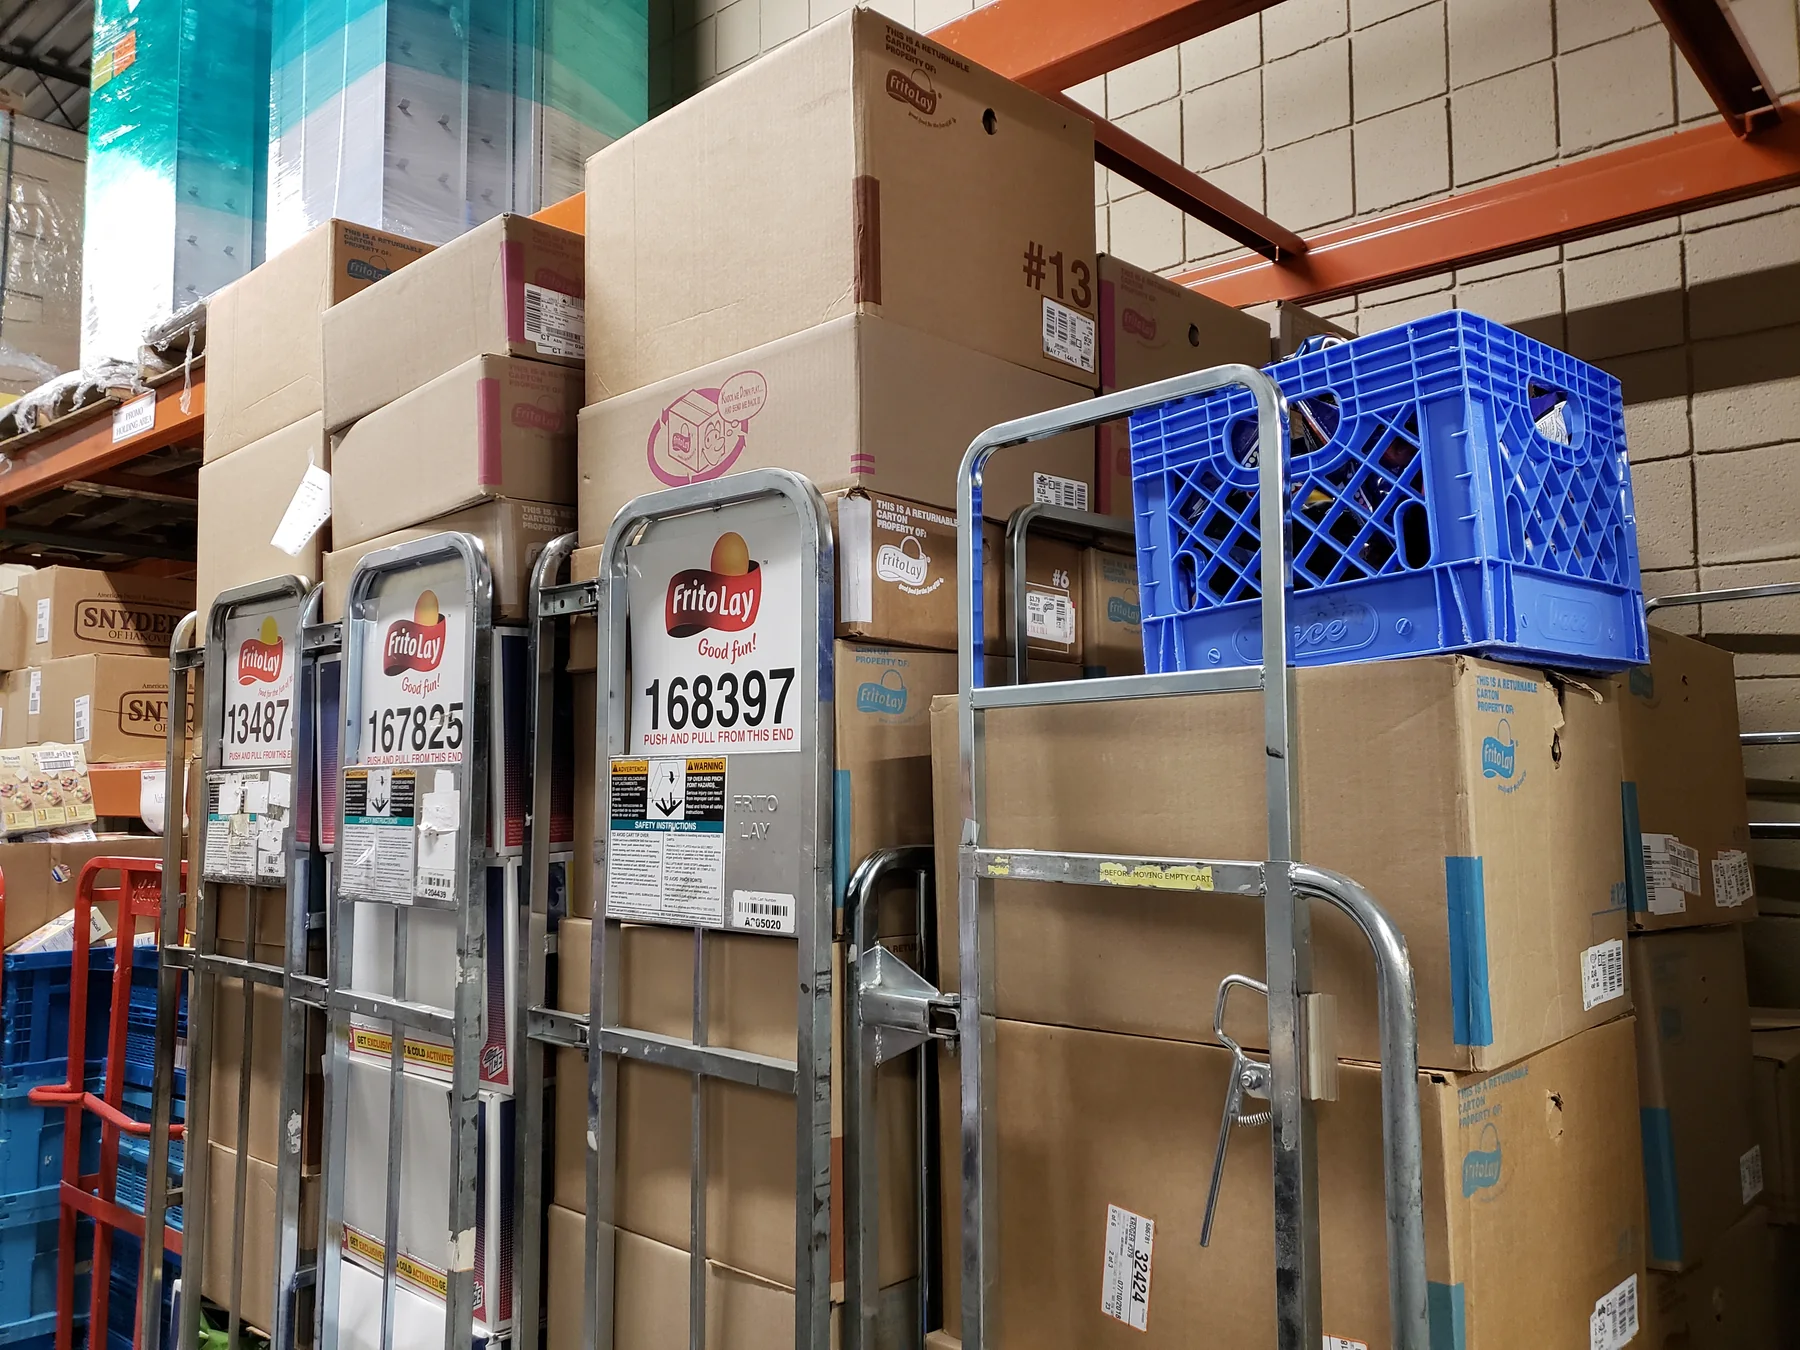
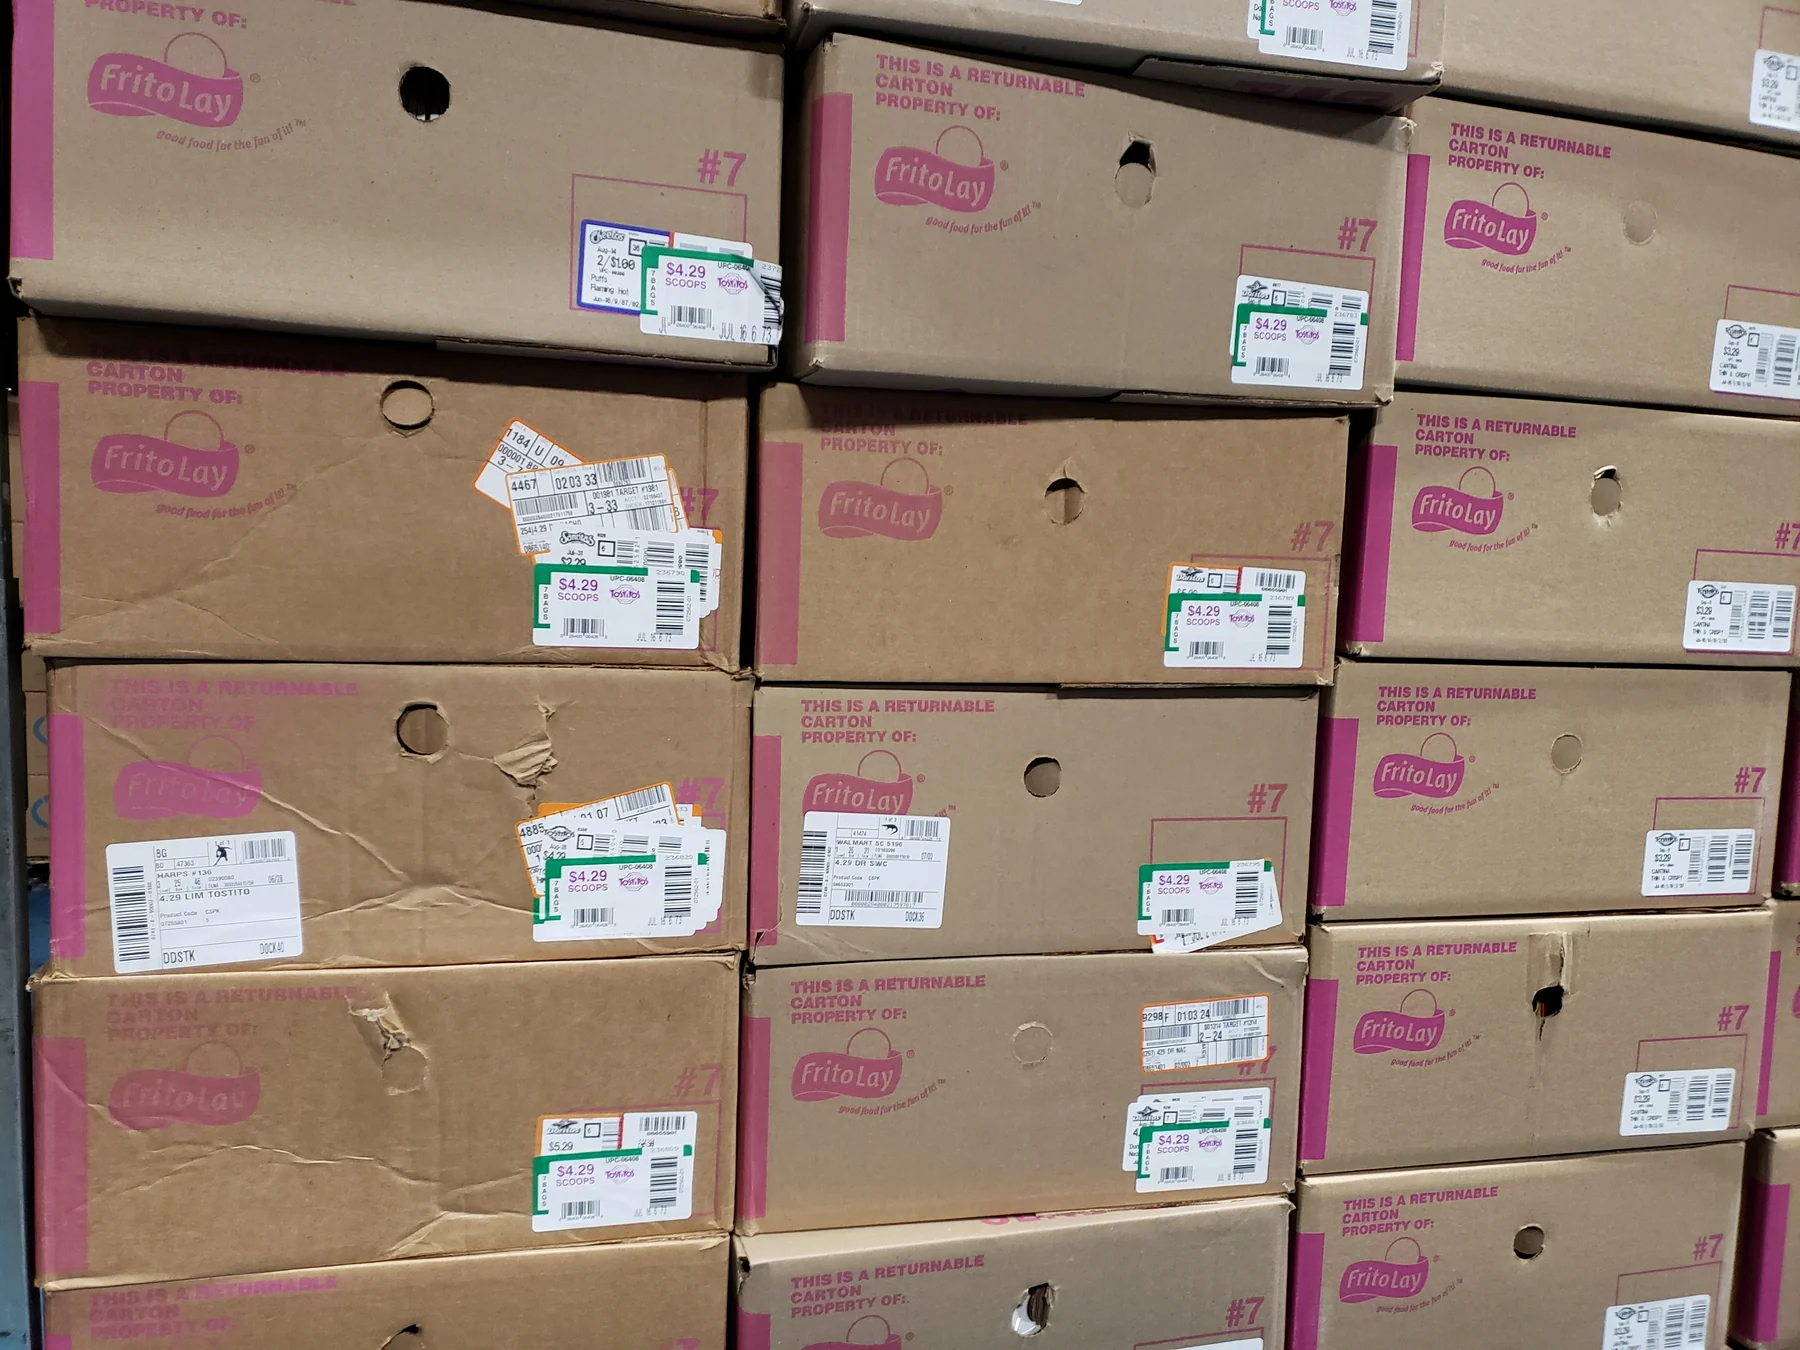
Warehouse trip, recorded during the return.
Field notes captured at the distribution center during the return trip that surfaced the warehouse problem. Portrait video, shot on the phone.
Seven observations, one system.
None of these came up in interviews. They only appear when you are the one pushing the cart.
- Nothing tracked the truck. The shortage was discoverable at the warehouse, on paper, before he ever left. He found it at the customer instead.
- There is no set map. Nothing tells a driver where product actually sits, so locating what you need is guesswork.
- The pick list is paper. He carries a printed sheet and matches it by eye against labels on cartons.
- The numbers are not reliable. Items carry numbers, but the numbers change — so drivers learn not to trust them.
- So he walked. Searching item by item, on foot, to fill roughly three carts.
- It is not one driver. The semi-truck drivers hunt the same inventory the same way, every day.
- None of this came up in interviews. It only appears when you are the one pushing the cart.
The exception is what exposed the system.
The driver I noticed was not a warehouse worker. He was a route employee, pulled into warehouse work by a failure that had happened upstream of him. That distinction is the whole design problem.
Whatever wayfinding the building has was built for people who are in it every day and carry the map in their heads. He was the opposite user: in the building occasionally, unfamiliar with where things sit, under time pressure, with a store schedule already slipping. Design only for the resident expert and the person who most needs help is the one who gets none.
It is also why the problem stayed invisible. On a normal day the workflow looks efficient because the exception never fires. Nobody had costed the search, mapped the building, or tracked the truck — and none of that mattered until something went wrong. The exception is what exposed the system.
Have an operation where the exceptions tell the real story?
Discuss a Field StudyA UX finding nobody funds. A line item they can act on.
A warehouse with no map is a UX finding. Nobody funds a UX finding. So the recommendation to leadership was to measure the time drivers spend searching, assign a cost to it, and estimate that cost across every driver and every route. That reframes an organizational annoyance as a line item — which is the version leadership can act on.
"How much is it costing Frito-Lay not to have this organized?"
Annual cost of searching
$1.7M
These are assumptions, not Frito-Lay's figures. That is the point: nobody had measured the inputs, so nobody could see the output. Move the sliders and the argument for fixing it either appears or it does not.
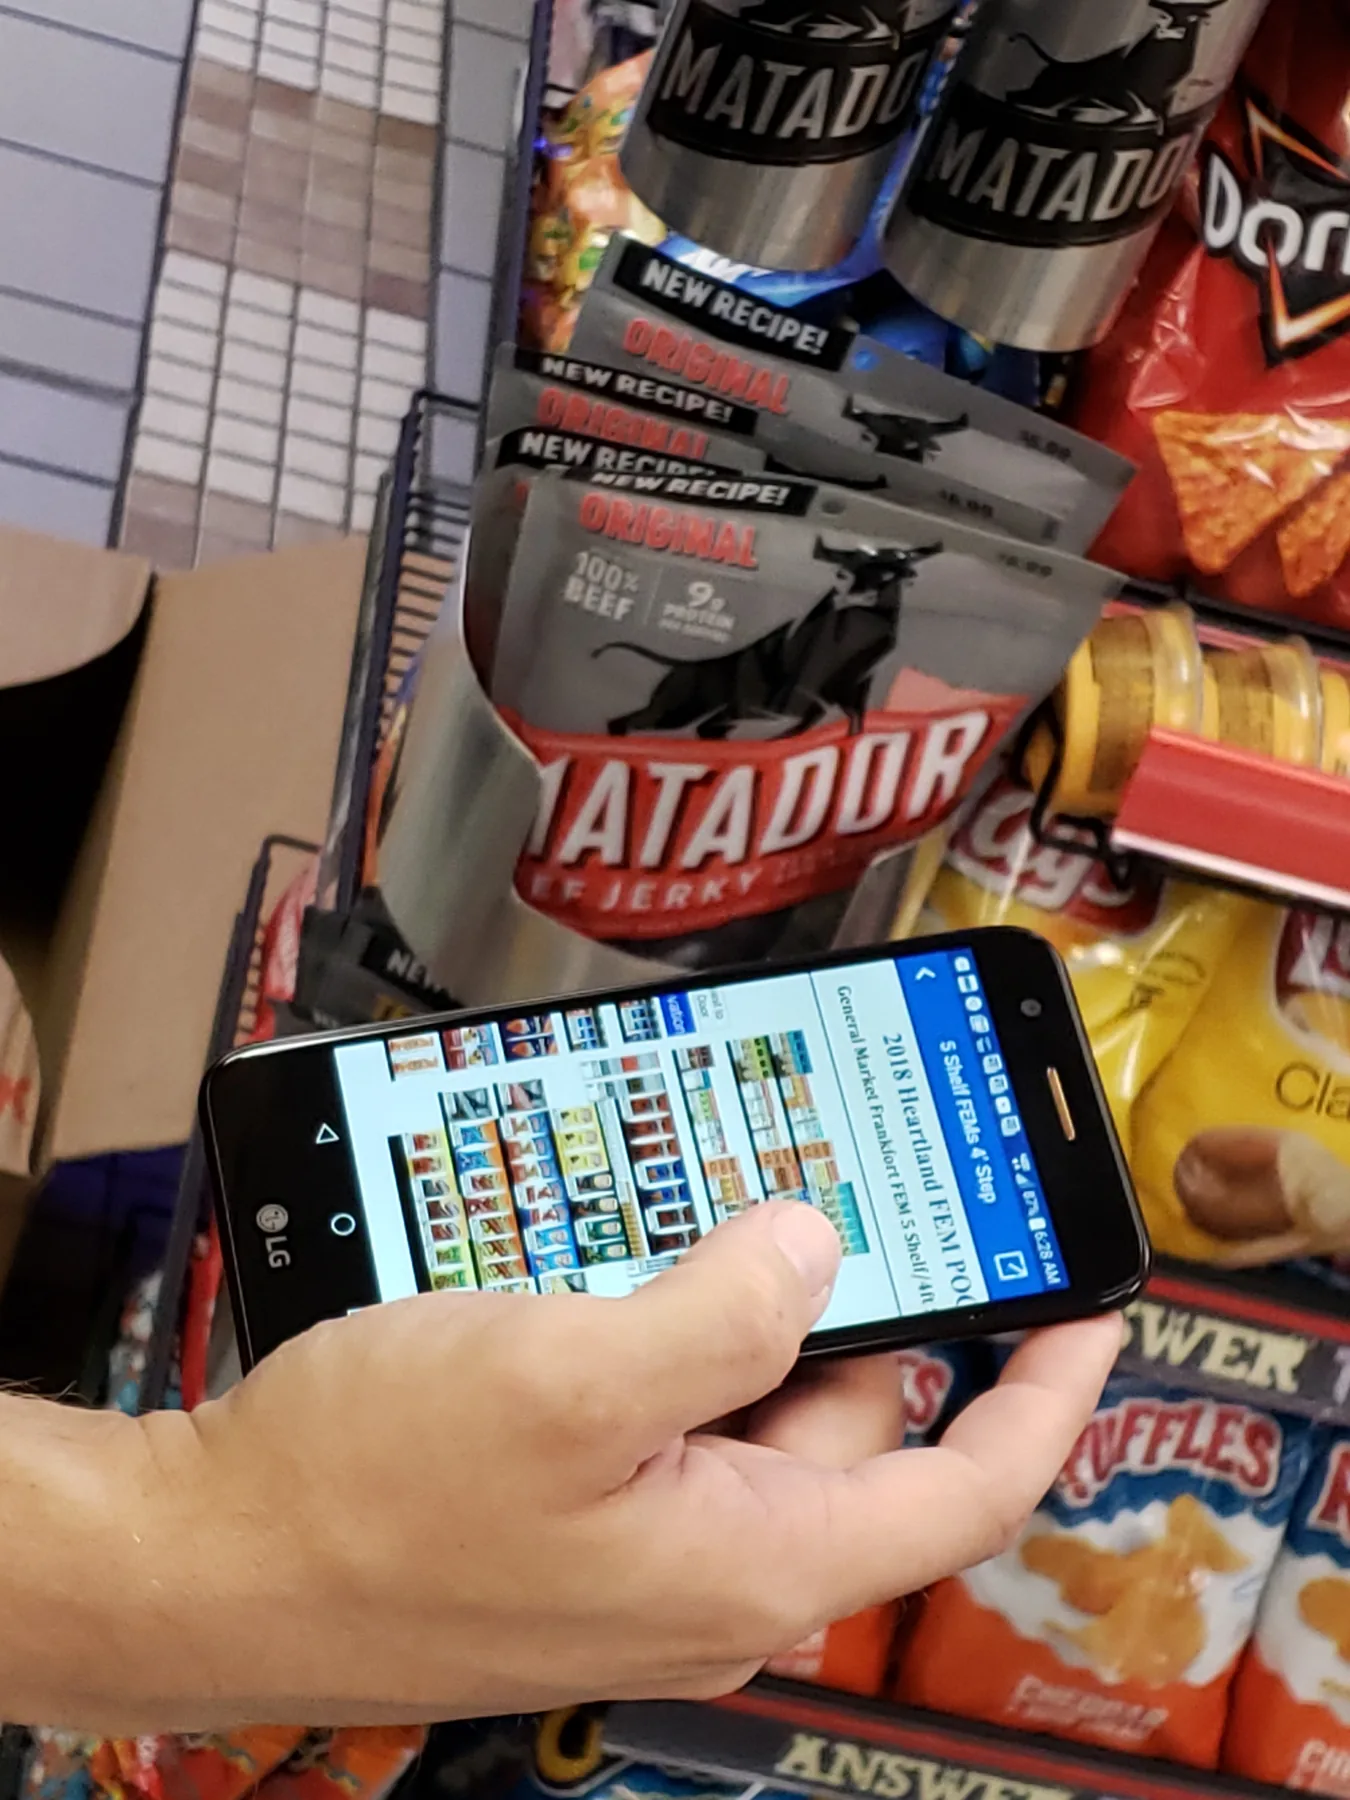
How drivers actually used the apps — and the workarounds they depended on.
I documented how drivers actually used the apps and workarounds they depended on to finish a route. The warehouse trip is one stop on this map, and it is the kind of detail that never survives the trip to a conference room without something concrete to point at.
What I would build now.
The paper sheet is the whole problem in one object: a list with no locations, no order, and no way to confirm anything until the truck reaches the customer. Four screens close that loop. Try them.
Tostitos Scoops, party size
4.99 TO ROUNDS · 10 units
Next after this: Bay 11, eight bays down the same aisle.
Tostitos Scoops, party size
Expected 10 units · Bay D‑03
Report a short
Tostitos Scoops · Bay D‑03
Say the product's name
The line on the sheet reads 3.29 BK CHS RUF. A new driver has to decode that against a sticker on one of a hundred identical cartons. Here the plain name leads and the code stays underneath for anyone who already thinks in codes.
The list is also sequenced by where things physically are, not by the order the system printed them — so the route through the building is a straight line instead of a loop.
On paper: three pages, no locations, print order.
The map that did not exist
Aisle, bay, slot, and the walk to get there. This is the missing artifact from the field study: nothing in the building told a driver where product actually sat, and the numbers that did exist changed often enough that people stopped trusting them.
Showing the next pick before the current one is finished is what turns a search into a route.
On paper: walk and read labels until you find it.
Verify the truck, not the shelf
Confirming each line as it is picked means the load is known before the truck leaves. That is the whole fix. The shortage that surfaced at the customer was discoverable here, hours earlier, by anyone.
Try it: change the count and confirm. The meter is the truck's actual state, not the order's intended state.
On paper: the customer's shelf was the error report.
Raise it where it can still be fixed
The delivery sheet already carries seven pre-printed error codes, which means the company had accepted that orders go out wrong. It just had nowhere to record one until the driver was standing in the store.
Same taxonomy, moved upstream. A short raised in the building can be refilled from another bay, or flagged to the account before anyone drives anywhere.
On paper: circle a code at the customer, after the fact.
The friction became a strategic priority.
Several years after this study, PepsiCo publicly identified much of the same operational territory as a technology priority. No claim of causation, and no line between the two. What it does say is that the friction one stressed driver exposed in a single afternoon was real enough to become a corporate program.
| What the field study saw | Later public priority |
|---|---|
| Product was hard to locate | Warehouse mapping optimization |
| Searching was manual, on foot, cart by cart | Case-picking automation |
| Locations changed, so the numbers went stale | Dynamic slotting by product type and velocity |
| Nothing told a driver what to do next | Task allocation |
| Nothing tracked what was actually on the truck | Inventory and stock visibility |
| Each step ran disconnected from the one before it | Warehouse orchestration and planning |
- 2023 PepsiCo Labs opens a North America warehouse program, seeking outside solutions for warehouse mapping, dynamic slotting, picking accuracy, and orchestration. Its own briefing describes operators pulling carts through warehouse locations and loading cases by hand.
- 2025 Salesforce Agentforce is deployed at scale, giving sales reps next-best-action suggestions across roughly five million retail locations. Separately, PepsiCo begins testing combined snack and beverage warehousing.
- Jan 2026 At CES, PepsiCo announces a digital-twin collaboration with Siemens and NVIDIA — recreating machines, pallet routes, and operator paths in simulation so changes can be tested before anything physical moves.
- Jul 2026 On the Q2 earnings call, CEO Ramon Laguarta describes "mixing centers" in the Texoma region scaling as a big idea: food and beverage inventory, delivery, and fleets combined in one place.
PepsiCo reported that the digital-twin work identified up to 90% of potential issues before physical changes, with a 20% throughput increase on initial deployment. Those are PepsiCo's results from its own later program, not results of this engagement. They are here because they put a number on how much value sits in the operational layer this study walked into.
Six artifacts. One argument.
Two weeks on the truck, filmed in VR 360. The readout used a headset, not a deck — because 360 video removes the step where someone has to take your word for a workflow.
One stressed driver in a Kroger became the study's most valuable moment. The warehouse gap he exposed is what turned an app project into an operational-layer conversation.
The paper was the whole problem in one object. Seven pre-printed error codes proved the company already knew orders went out wrong — and had nowhere to catch one before the truck left.
A slider-driven estimate that turned a UX finding into a line item leadership could act on. The point was not the exact number; it was making the inputs visible so the output existed at all.
The list, the map, the confirm, the short. Four screens that verify the truck instead of the shelf and raise a shortage where it can still be fixed. Concept only, not shipped work.
Delivered alongside the study, for the CTO's innovation team — so the pattern of "get in the work, then design" could keep running after the engagement ended.
Design only for the normal day, and the person who most needs help is the one who gets none.
For enterprise teams building operations, logistics, or field-service software, the biggest risk is designing for the resident expert and missing the exception user — the new hire, the covering employee, the person pulled in when something breaks. Those are the users who expose whether the system actually holds up. A short field study aimed at them pays for itself many times over, and it is almost always the finding leadership had already accepted as normal.
Bring the same approach to your
next field study.
If your team is building for an operation you have never worked in, or trying to convince leadership that a two-week embed is worth the delay, I can help you get to a finding executives can stand inside — in the same short arc that carried this one.
A note on imagery and artifacts
- Photographs are from the field study
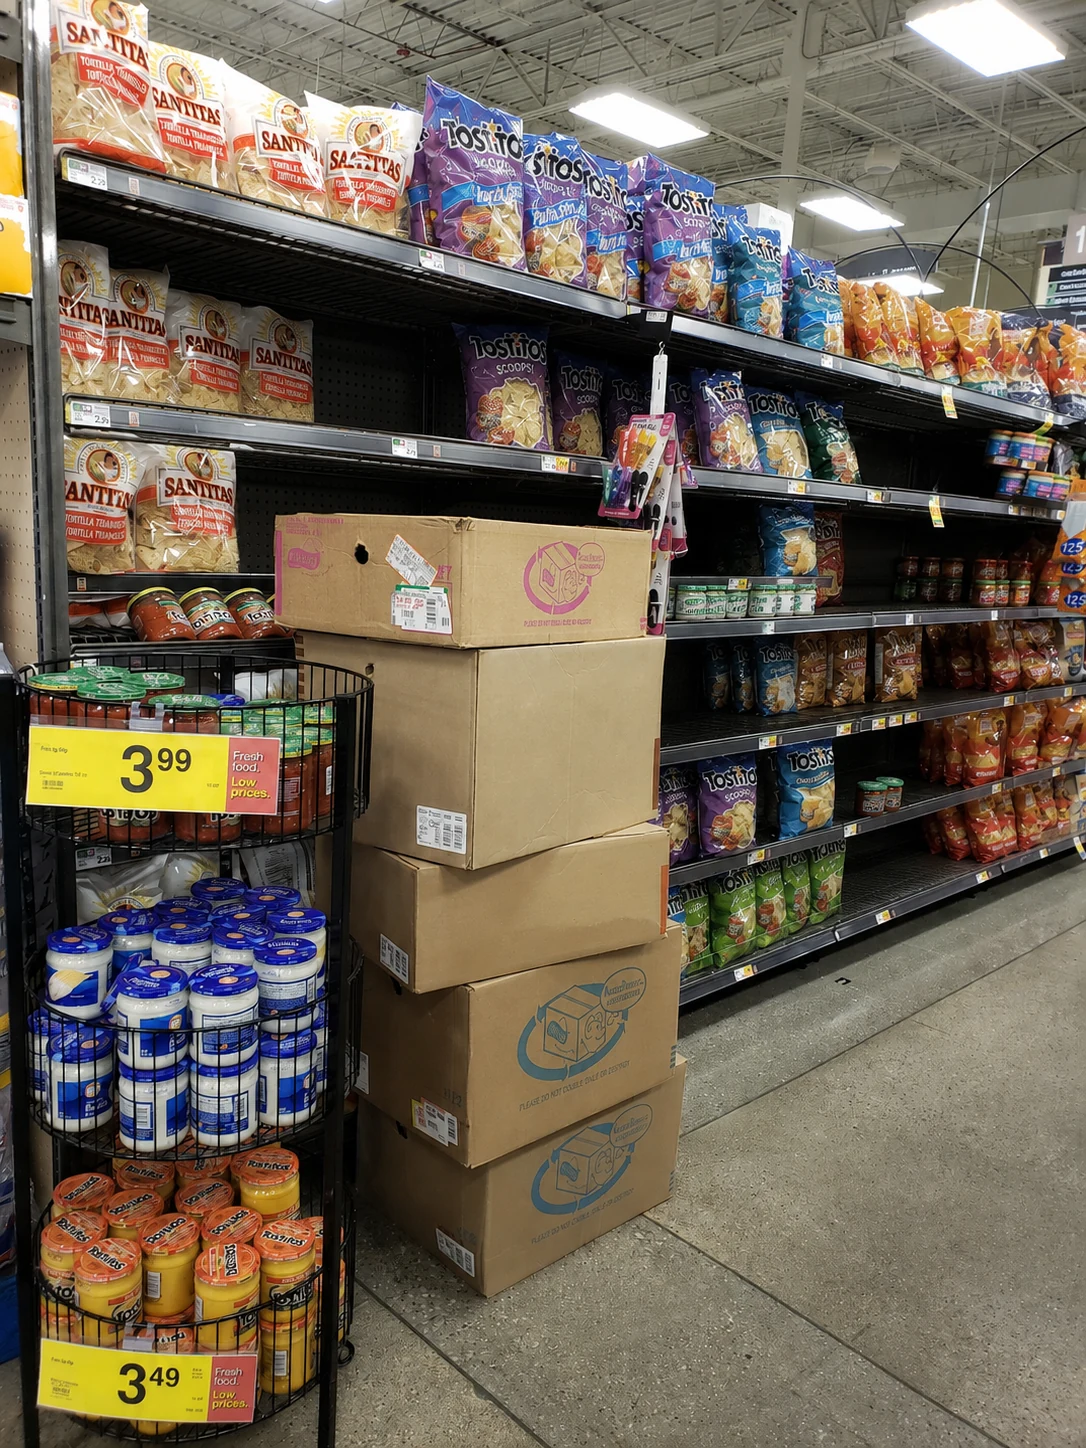
- Shot on the route and inside the distribution center in July 2018 (EXIF-verified, Samsung SM-G965U). Faces are blurred, since the people in them were at work and are not part of the story.
- One image is a recreation, not evidence
- The end-cap with an empty cell was altered to picture the shortage described here. It shows the scenario rather than the moment, because the display the driver could not finish was never photographed.
- The delivery sheet is rebuilt
- Redrawn from the original with example values. The seven error codes are verbatim; the customer, order, and product numbers are not, since the real sheet carries a retailer's address and live order details.
- The prototype and cost model are concepts
- Both were built for this case study to show what the research argues for. No part of either was delivered to Frito-Lay, and the cost figures are assumptions the reader sets, not the company's numbers.
- The strategic timeline is public reporting
- The 2023, 2025, January 2026, and July 2026 entries are drawn from PepsiCo's own public communications, press coverage, and analyst reports. The pairing with the field-study observations is thematic, not causal.